Observability & audit
How it works
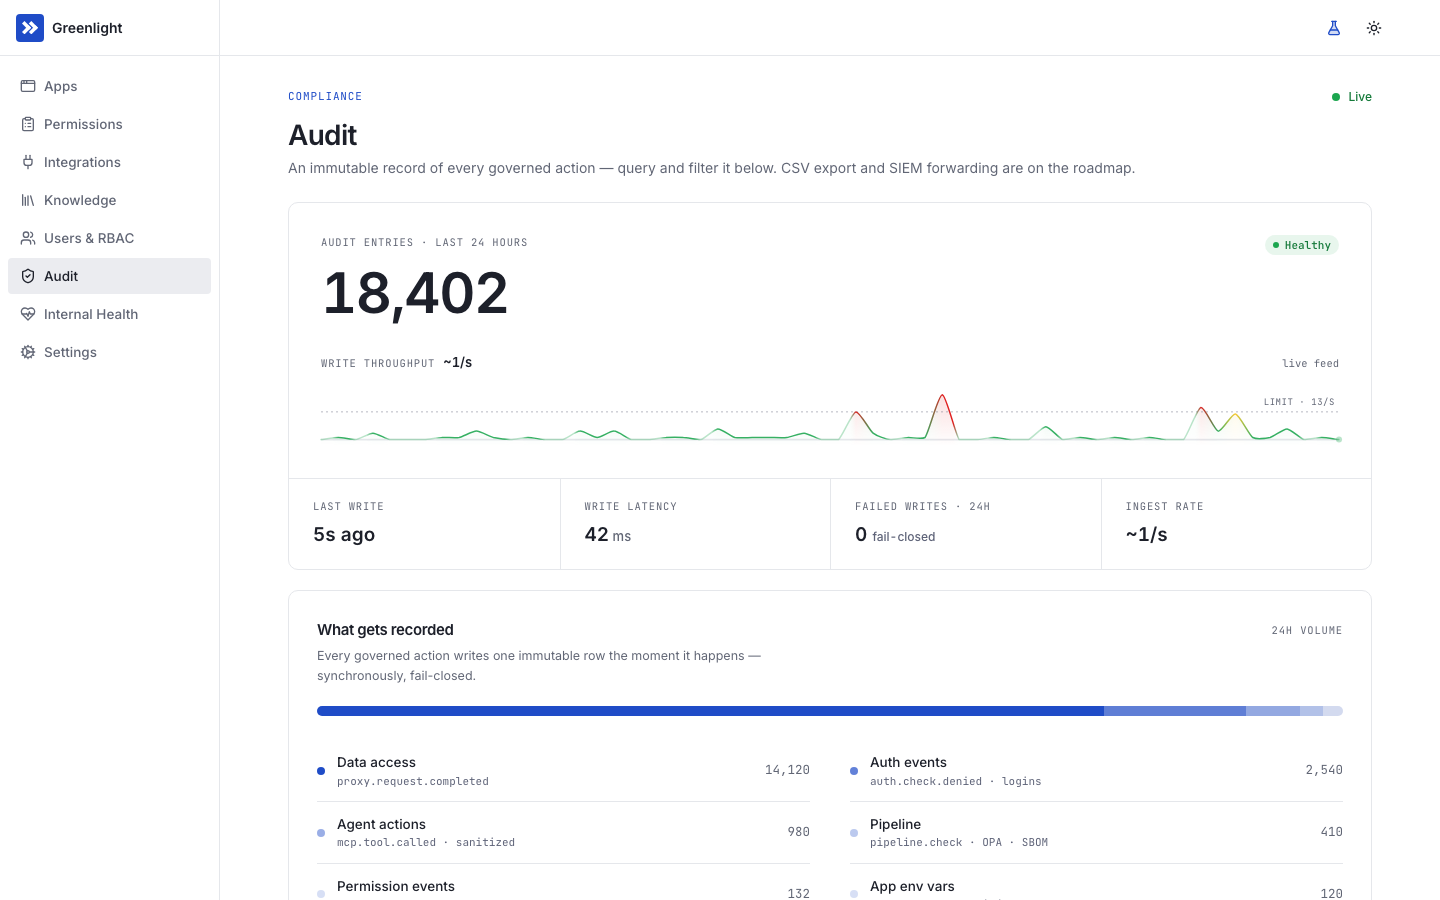
Greenlight separates two things that often get conflated. The audit log is the record of every action that affected what an app can do — who took it, when, against what, and why. Runtime observability is the live picture of how apps and integrations are performing: logs, metrics, errors, latency. Both are surfaced in the IT dashboard; the underlying stores are different so they scale independently.
What’s audited
Section titled “What’s audited”Every action that affects an app’s permissions, code, configuration, or state writes an audit event. The set of audited categories is fixed and visible in the dashboard.
| Category | Examples |
|---|---|
| Platform actions | App registered, integration registered from the catalog or as a custom integration, integration granted to an app, policy added or changed, role assigned, integration or credential soft-deleted, platform release observed or applied (including a failed or canary update run), an update started by hand from Internal Health |
| Agent actions | Pull request opened, Knowledge proposal submitted, proxy call made, policy bundle read, deployed app data inspected |
| IT actions | Policy check overridden, app killed or restored, integration credential rotated, local-dev delivery toggled for a credential, user role changed |
| Auth events | Dashboard logins, /auth/check denials, token issuance, and OAuth authorization-server failures (auth.authorize.failed / auth.token_exchange.failed) with a distinct reason for each rejection (bad client, PKCE mismatch, code replay, deactivated user, …) |
Reading data through the data broker is also audited at the per-call level, with the bound user attached.
Audit event shape
Section titled “Audit event shape”Every event has the same shape, regardless of category:
{ "id": "evt_01HQX5MWGRTYBJ7C7C7C7C7C7C", "timestamp": "2026-03-12T14:08:11.412Z", "category": "knowledge", "event": "knowledge.proposal.accepted", "actor": { "type": "user", "actor_id": "usr_jane_doe", "actor_channel": "dashboard" }, "target": { "kind": "knowledge_entry", "id": "kn_pf2", "scope": "app", "app_id": "app_k9x2m3p" }, "diff": { "version": [3, 4], "title_changed": false, "body_chars_added": 412 }, "reason": null}actor.type is one of user, agent, or system. An agent acting on a person’s behalf still attributes to that person — the delegated user id sits in actor_id — while actor.type: agent and actor_channel: mcp make it clear the proximate cause was the agent rather than the person clicking in the dashboard. Platform-internal actors with no delegated user (the updater, scheduler, queue workers) use system.
When an Org Owner is logged in as another user, every event is attributed to the real Org Owner — not the person they’re viewing as — and tagged with who they were viewing as, so “Jane did X while viewing as Bob” is always distinguishable from Jane acting as herself.
The structured form is consistent across event types: a monotonic time-ordered identifier, the actor (type, delegated user id, channel), the target object, a structured diff for state changes, and the reason text for events that require justification (overrides, kill-switch invocations). Auditors don’t have to interpret different shapes for “policy override” vs “Knowledge accepted” vs “integration revoked” — the wrapping is the same.
Data access is audited per call
Section titled “Data access is audited per call”A proxied integration writes one audit record per call: the app, the acting user when one is present, the integration, the upstream URL, the HTTP method, the response code, and the latency. The credential value never appears — the record names which integration credential was used, not its contents. Because the credential is substituted inside the broker and never reaches the app, attribution is per user, not per shared credential: a service_account integration shows the bound user behind each call, and a user_delegated integration records the same user whose token was exchanged upstream.
When a call shows System instead of a person
Section titled “When a call shows System instead of a person”Not every proxied call has a person behind it. Background work — timers, queue consumers, scheduled jobs, startup tasks — genuinely has no user, so System is the honest answer rather than a missing value. But the same System also appears when an app does serve a signed-in person and simply doesn’t tell Greenlight who: attribution rides a header the app forwards on calls it makes while handling a user’s request, and an app whose code predates that convention won’t be forwarding it.
The audit page’s User attribution panel separates the two. For each app with proxy traffic in the last week it shows how many calls named a user, and — crucially — whether that app served signed-in users at all in the same period. An app with no attributed calls and no signed-in users is doing background work and is behaving correctly; an app with no attributed calls that did serve people is the one worth fixing. The fix is in the app, not the platform: its agent forwards the header the next time it touches the code, and coverage improves from there.
Injected integrations — the cases where a database wire protocol or a request-signing scheme can’t ride an HTTP proxy, so the app connects directly with an IT-managed credential — are audited at the grant level (who was granted access to what) rather than per call, since those calls don’t transit the broker. The data broker page describes which integrations are proxied vs injected and why.
Local development is audited too
Section titled “Local development is audited too”When a builder works locally, the bundled greenlight CLI pairs once over its MCP session and then runs the app with greenlight run. That loop is fully audited:
- Session pairing records when a CLI session was approved — the start of the local-dev trail for that builder.
- Proxied calls from the laptop land in the same per-call data-access log as deployed traffic, attributed to the same user, because local
greenlight runreaches the same broker URL the deployed app uses with a short-lived, app- and user-scoped token. No credential is ever on the laptop. - Data inspection of a deployed app — reading the app’s database, calling one of its integrations read-only, or listing a blob container — runs inside the control plane and returns results only. Each inspection writes its own audit event under the
data_inspectioncategory, naming the app and what was inspected. Credentials are never returned and never logged.
No environment value or credential ever passes through the agent or MCP. The local-dev events make a builder’s exploration of production data as legible to IT as a deployed app’s runtime traffic.
Working the log
Section titled “Working the log”Open Admin → Audit for the org-wide view. Filters by category, actor, target, and time range are typed fields in the filter bar — there is no separate query language to learn, and everything composable through the UI is composable through the audit API the same way.
Useful day-to-day filters:
- Overrides this week — every time someone overrode the policy check. Pair with the reason text to spot policies that are routinely bypassed.
- Agent actions per user — who’s working with their agent the most and what they’re doing.
- Integration grants and revokes — the source of truth for “who got access to what.”
- Data inspection by app — every time a builder read a deployed app’s database, integration, or blob storage from a local session.
- Kill/restore events — every incident-style action.
Runtime logs and metrics
Section titled “Runtime logs and metrics”Each app’s stdout and stderr are captured per pod and surfaced live in the Logs tab of the app’s detail page, scoped per app per environment, with search and time-range filtering inline. Default retention is configurable per org.
Per-app metrics cover container CPU, memory, and restarts out of the box, rendered as history charts with a selectable time range alongside the current snapshot; request rate, latency percentiles, and per-upstream integration call rates extend this as the platform’s collection points light up. There is no separate APM agent to install — Greenlight collects from the platform’s natural seams (the ingress controller, the data broker, the AI gateway, the Kubernetes runtime) and stitches everything together by app id.
Greenlight also answers the adoption question — is anyone actually using this app? Because every authenticated request passes through the platform’s SSO check, Greenlight counts per-app daily active users, request volume, and last-active time for every app automatically, with no instrumentation in the app itself. Only aggregates are kept: IT sees counts and trends, never a browsable history of which person opened which app when.
When a deployed app misbehaves, the agent reads its logs, a consolidated diagnostics snapshot (pod status, probe results, resource pressure, the masked env-var key set, and dependency reachability), and — for the data behind a bug — the read-only inspection tools described above. There is no shell into a running pod: a shell would act as the workload rather than the developer and bypass the pull-request path, so the diagnostics and inspection surfaces cover the troubleshooting need instead.
The dashboard isn’t intended to replace a full log aggregator. Customers who want long-term log analytics ship the cluster’s logs to their own aggregator using the cloud’s native log shipping (Azure Monitor, Cloud Logging, CloudWatch) — Greenlight doesn’t sit in that path.
Retention and exports
Section titled “Retention and exports”Audit events live in the control plane’s audit store and stay queryable across the full history — there’s no cold-archive tier to re-fetch from; search and exports work uniformly over the whole range. The retention horizon is the org’s policy choice; old events are not archived to tape, they remain in the live store.
CSV/JSON export for any time range and a SIEM webhook (push to Splunk, Datadog, or any HTTPS endpoint, HMAC-signed, with cursor-based replay) are coming soon. The export patterns they’re designed for: a quarterly export for SOC 2 or ISO evidence files, a targeted export filtered by user, app, or integration for an internal investigation, and a continuous feed into a customer-side SIEM.
Tamper resistance
Section titled “Tamper resistance”Today the log is append-only at the storage layer, with access restricted to admins through the dashboard and the audit API, backed by the control-plane database’s point-in-time recovery. The next hardening step mirrors every event into a WORM (write-once, read-many) object store with a time-based immutability lock and per-entry HMAC signing — the storage layer refuses overwrites within the retention window, and the HMAC lets a reviewer detect any altered field, so the evidence becomes tamper-evident rather than append-only by convention.
What’s not in the log
Section titled “What’s not in the log”Request and response bodies for runtime traffic are not in the audit log. Audit records reference an integration call and capture the call’s metadata (URL, method, response code, latency, bound user), but they do not store payloads. The same holds for data inspection: an inspection event records that an app’s database or integration was read and by whom, never the rows or the credential. Apps that need payload-level evidence — an SAR fulfillment trail, say — should write that into their own dedicated store; Greenlight’s audit log is not designed to be a payload archive.