Tour the dashboard
Product tour
The Greenlight dashboard is the single operational surface for IT — every app, integration, grant, user, and audit event in one place. This page is the five-minute visual map: what each screen shows, with a link to the page that explains how it works.
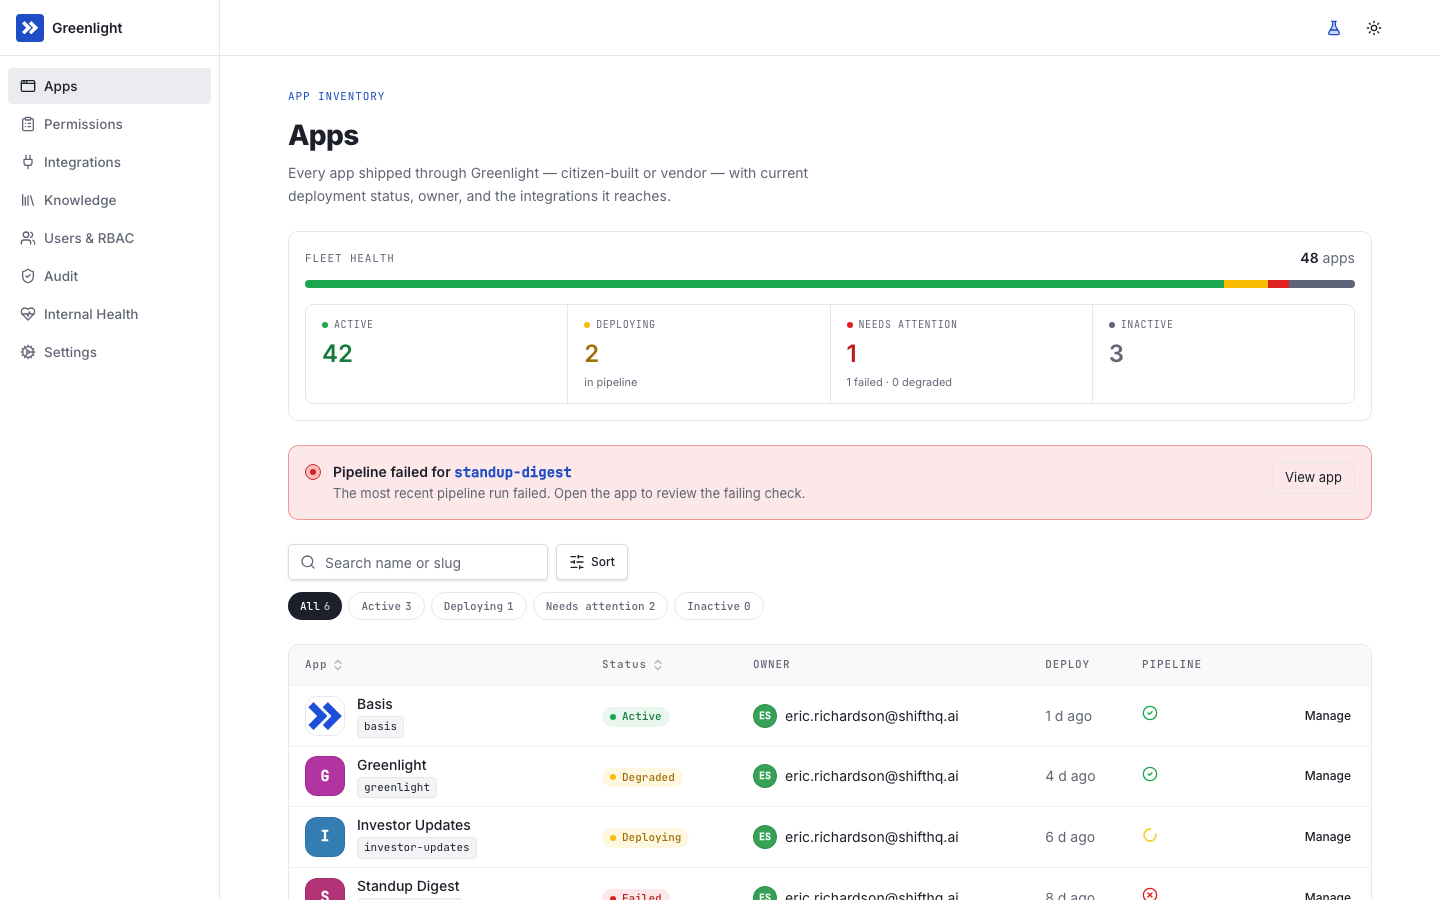
The fleet at a glance: every app with status, owner, and Last Updated — when it last deployed, with the outcome of that pipeline run beside it — immediately left of Manage. Who can use an app is set on the app’s own Access tab, not from this list. IT also sees a usage signal — how many people used the app over the last week, with request volume beneath it, and sortable by that same headcount — plus a health bar and alerts for anything that needs attention. Citizen developers additionally see the org’s available integrations (names and logos) so they know what to ask their agent to build with; a long list stays behind View more. This is where most of the day-to-day starts.
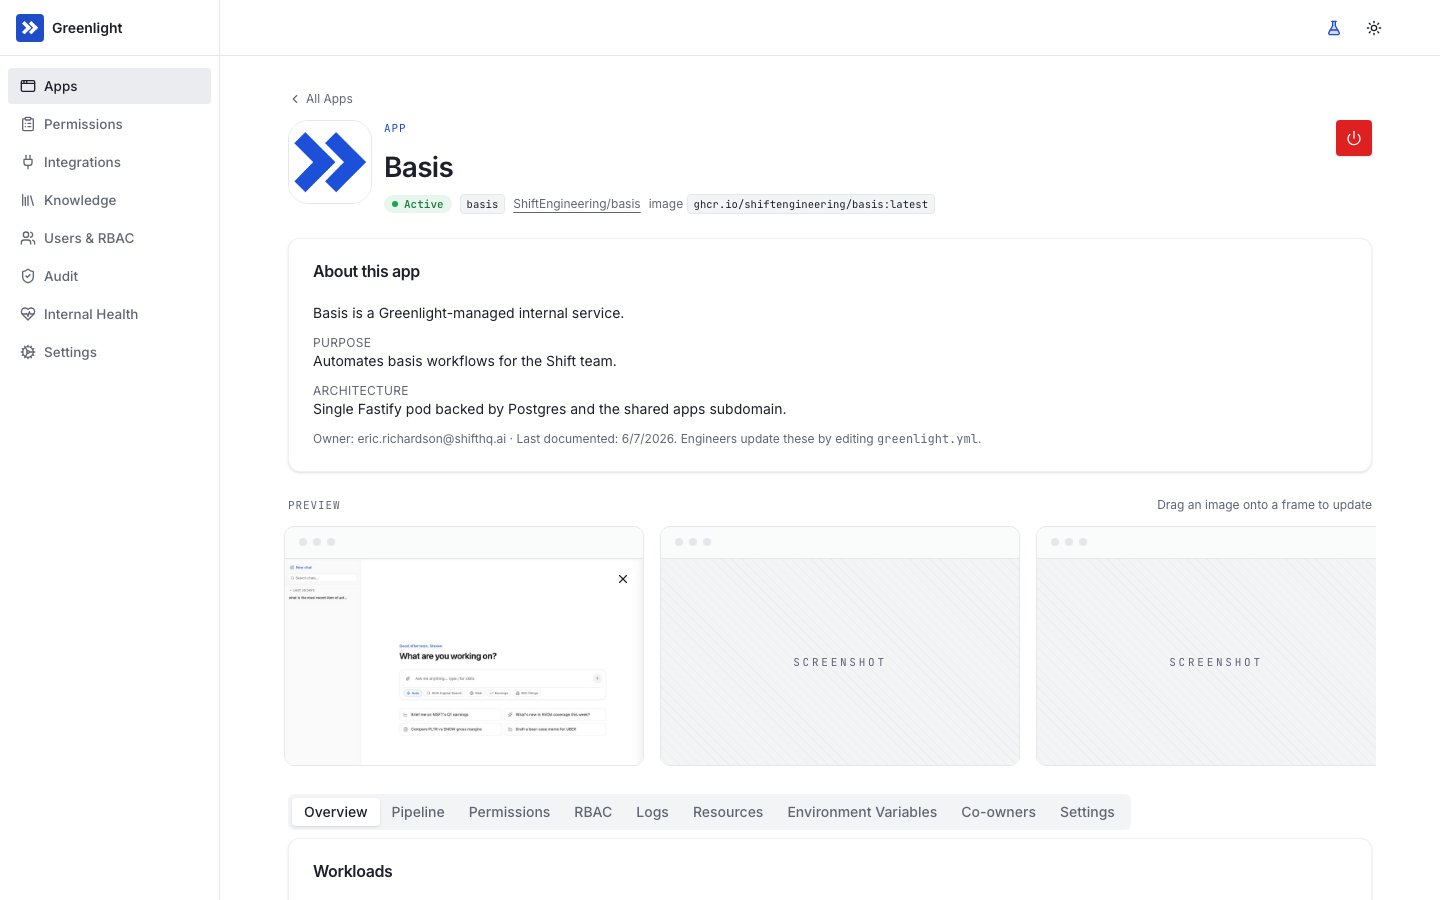
Clicking an app opens its detail page — itself a small dashboard grouped into five tabs: Overview (with a system map of the app’s workloads, provisioned resources, and connected integrations), Deployments (pipeline runs), Access (who can use the app, permissions, RBAC), Monitoring (resource metrics, usage analytics, and logs), and Configuration (environment variables) — plus a header power menu for the app’s lifecycle actions: pause/restore and delete. A deployed app’s URL is editable from the header (owner or IT): pick a new subdomain under the apps domain and every link follows; the old address stops working immediately, with no redirect. → App deployment & isolation
Pipeline runs
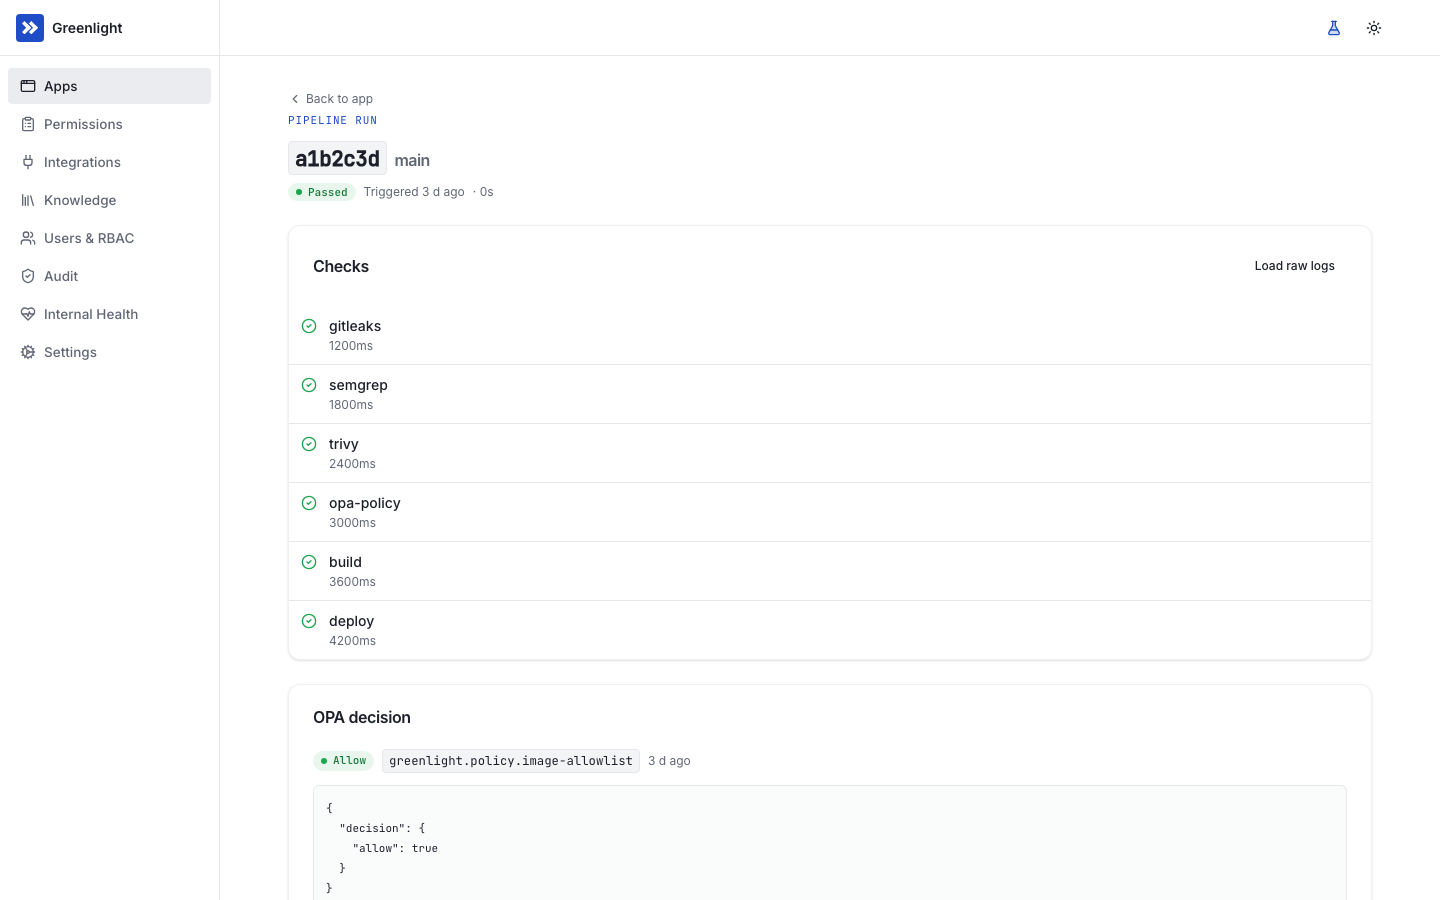
Section titled “Pipeline runs”Every pull request’s run with a per-check verdict — secret scanning, dependency scan, SBOM, policy engine, build, deploy, plus Greenlight’s own verification that the run and its evidence came from the pipeline it installed — and the OPA decision in full. A merge run may show its scan checks as skipped with a note naming the earlier run its findings came from: the content was identical, so Greenlight reused evidence it had already verified rather than scanning the same files twice. Deploy runs also carry release notes, captured from the merged pull request’s title and body, so you can tell what each release changed without opening GitHub. → Source control & the policy check
Marketplace
Section titled “Marketplace”Browse the live apps your colleagues have built and open them — one consumer-facing card per app, with its icon, cover, owner, tags, and summary. Always available to everyone signed in.
You only ever see apps you can already open. An app its owner has restricted to a named group of people is not listed to anyone else, so there is no locked card and nothing to request: if you have heard about an app and cannot find it, ask its owner to add you.
Each card has a star and a hide control, both just for you — nobody else’s view changes, and neither affects who can open the app. Starred apps sort to the front, including across pages. Hidden ones drop out of your catalog and come back through Show hidden apps, where you can unhide them from the card itself; hiding also offers an undo. These are the same personal flags the Apps page used to carry — they live here now, because pinning and suppressing cards is a browsing job, not a management one.
Integrations
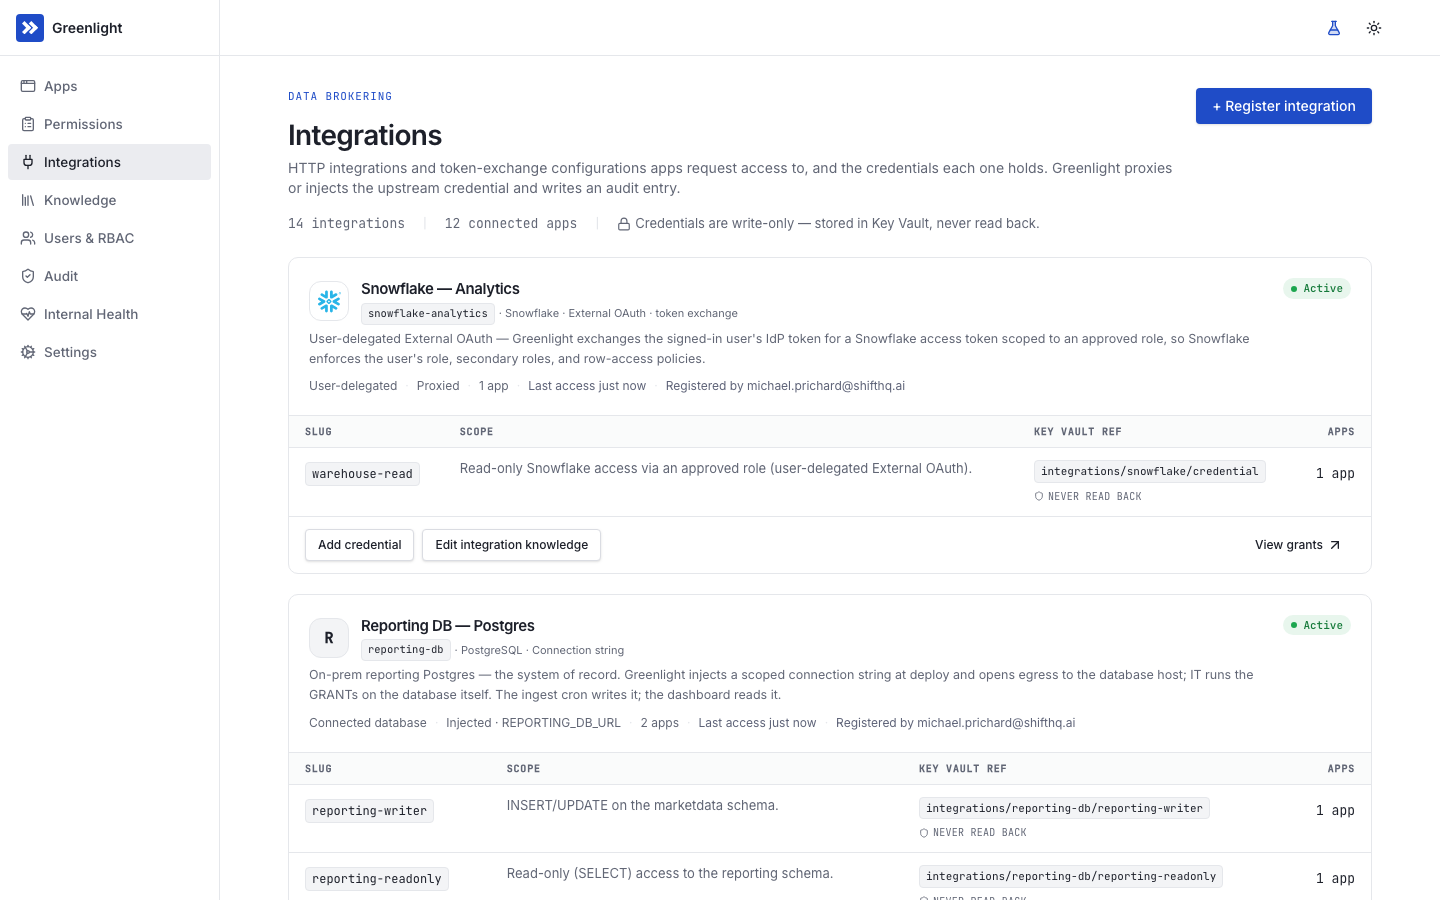
Section titled “Integrations”One tab for the org’s outbound integrations and the grants apps and people hold against them, with a control to switch between two sub-views:
- Integrations — a Requests to connect panel at the top when someone’s agent has asked for a system your org hasn’t connected at all: who asked, why, and Approve & register (which opens the usual Register dialog already filled in) or Decline (which asks you for a reason). These are never auto-approved, and approving on its own connects nothing. The panel is only there when something is waiting. Below it, one compact card per upstream service: logo, name, an availability switch, and a Review needed badge beside the name when something is waiting. Each credential sits on its own line — slug, description, auto-approval switch, and Edit/Delete — with everyone (app or person) who requested or holds it behind a small Access granted to dropdown, showing status and when. Pending rows are approved or denied and granted rows revoked right there. Everything else about the record — base URL, auth mode, delivery — stays behind Edit integration rather than on the card. Making an integration inactive keeps it visible to IT while hiding it and its Knowledge from agents until reactivated. IT registers from a searchable, logo’d catalog (GitHub, Slack, OpenAI, Salesforce, Snowflake, …), or a Custom path for anything not catalogued. → Manage integrations
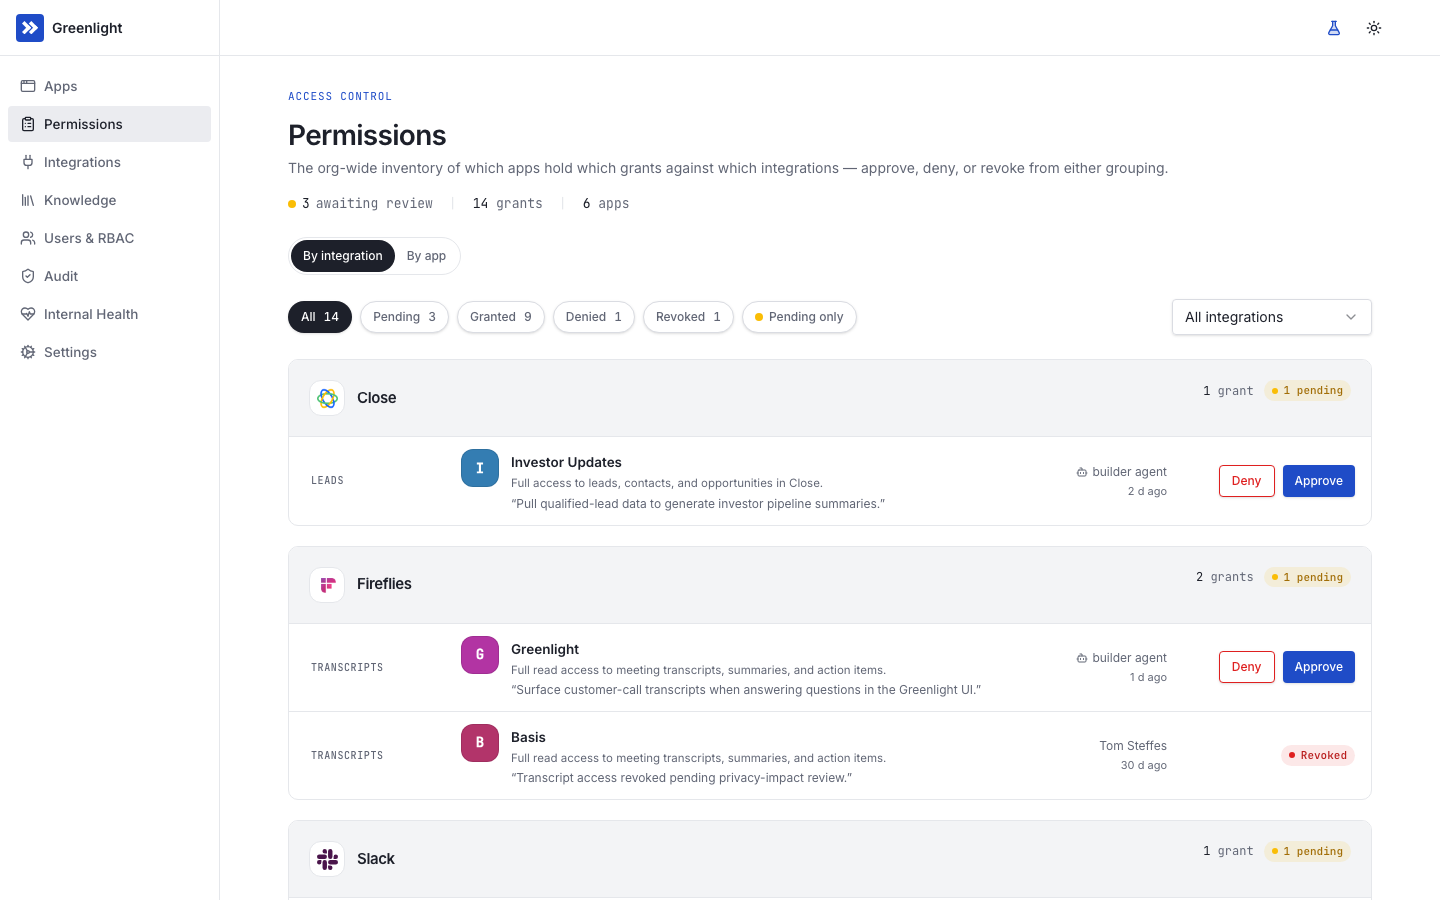
- Grants — the org-wide inventory of which access holders — apps and people — hold which grants, grouped by integration or by access holder, with pending requests triaged in place. Personal requests (made through a user’s agent or CLI) land here beside app requests. This is where IT approves, denies, and revokes. → Governance & policy
Knowledge
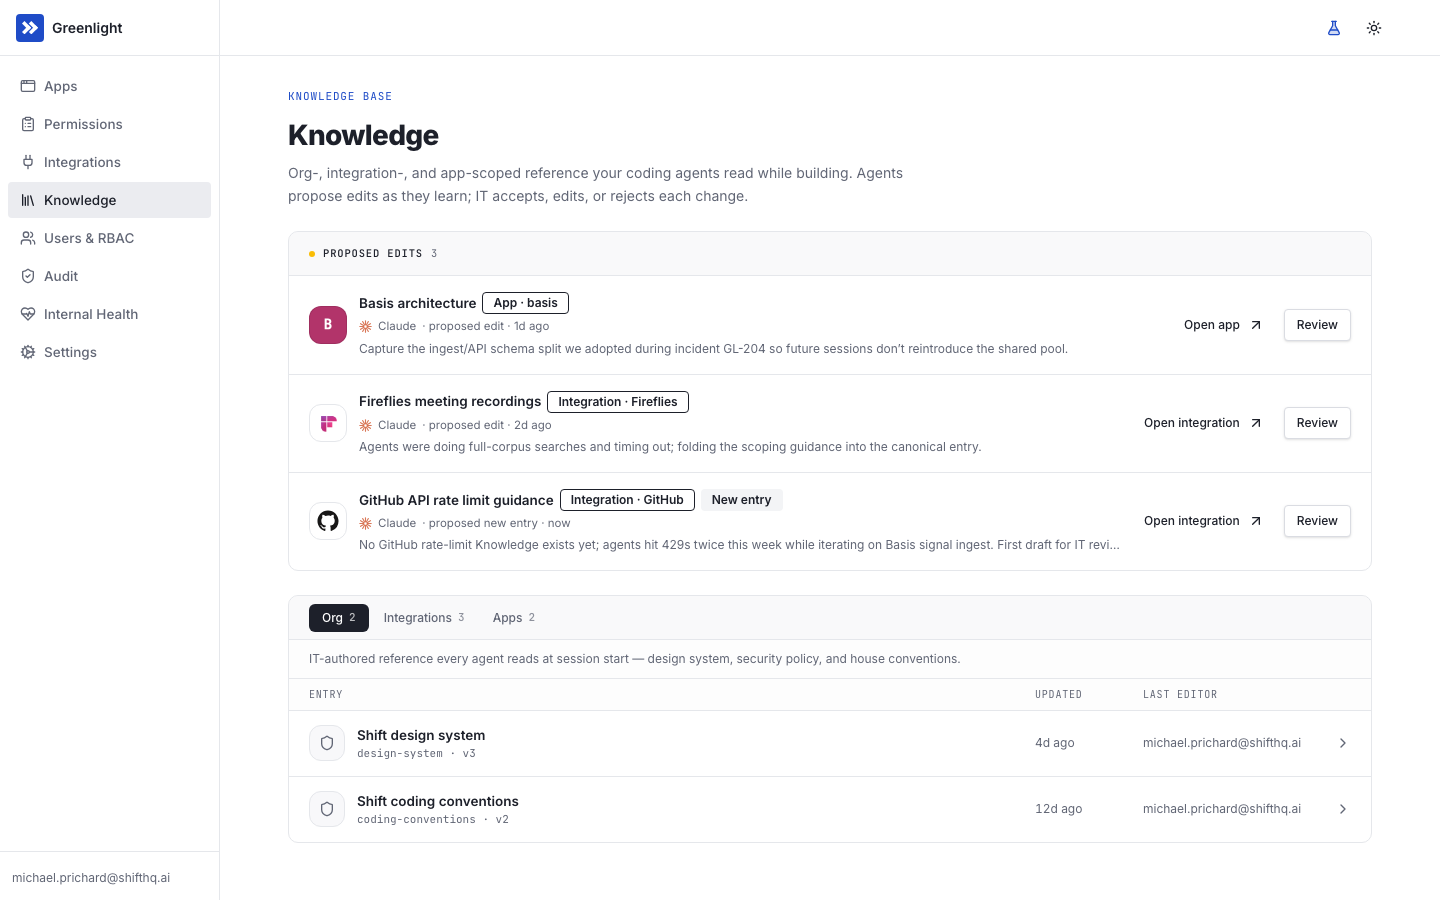
Section titled “Knowledge”Org- and app-scope entries plus the queue of pending agent proposals to review, accept, or reject. → Curate Knowledge
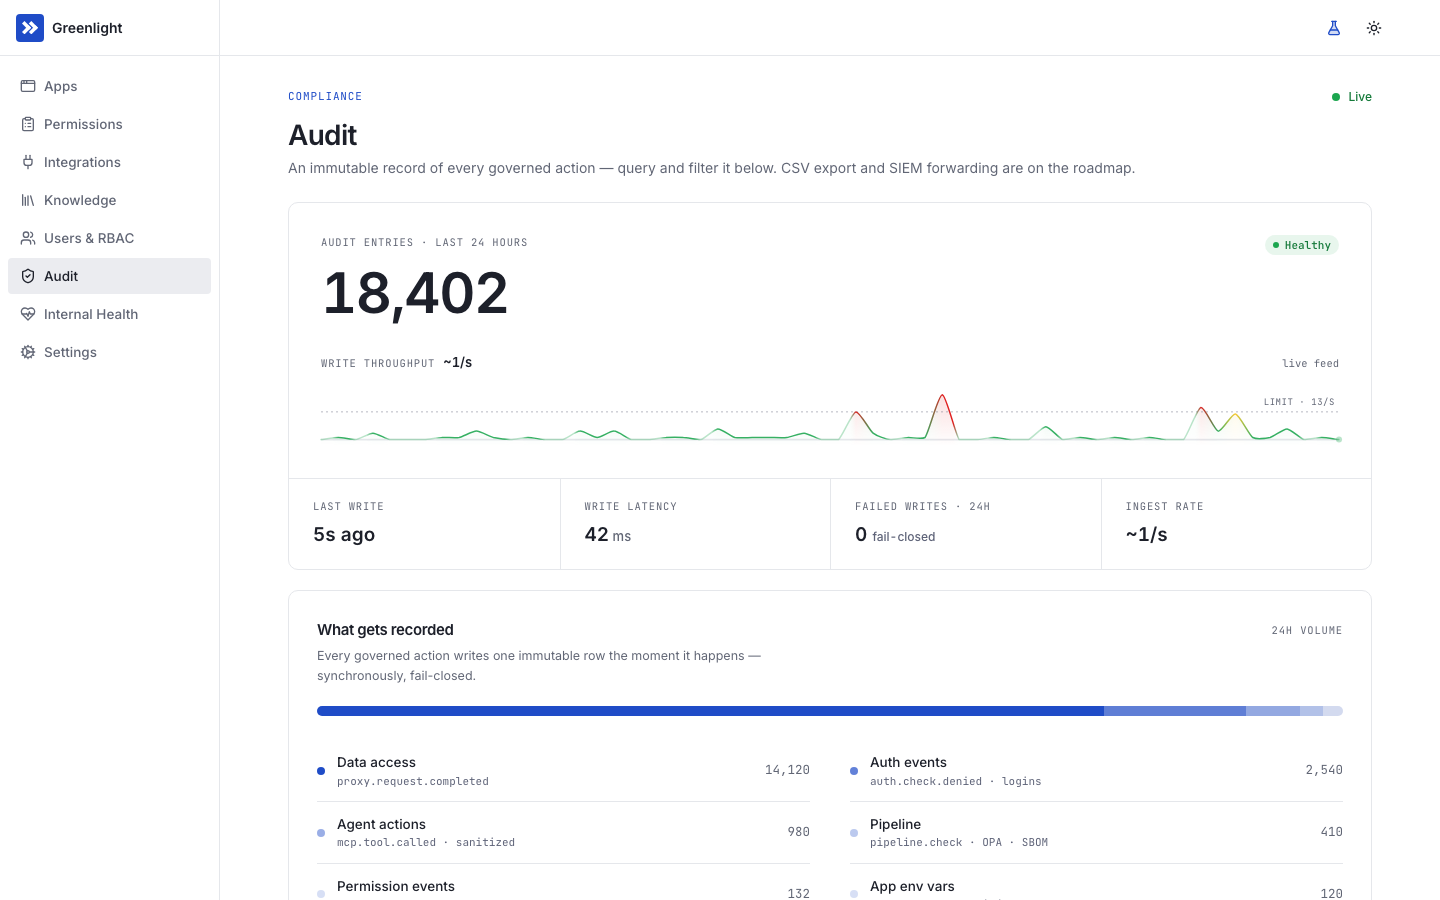
Audit health, live write throughput, and the queryable log of every governed action — filter by event, app, actor, and time range. A User attribution panel answers the question the log itself can’t: which apps record data calls without naming the person behind them, and which simply have no person to name. → Observability & audit
Compliance
Section titled “Compliance”The SOC 2 common criteria laid against the Greenlight mechanism covering each one, with every row linking to its live proof and the whole mapping exportable as JSON or CSV for your compliance platform. HIPAA and GDPR sections appear on the same page when the installation is in that framework’s scope. It reports control coverage and evidence for the apps Greenlight governs — not a certification claim. → Compliance
Users & RBAC
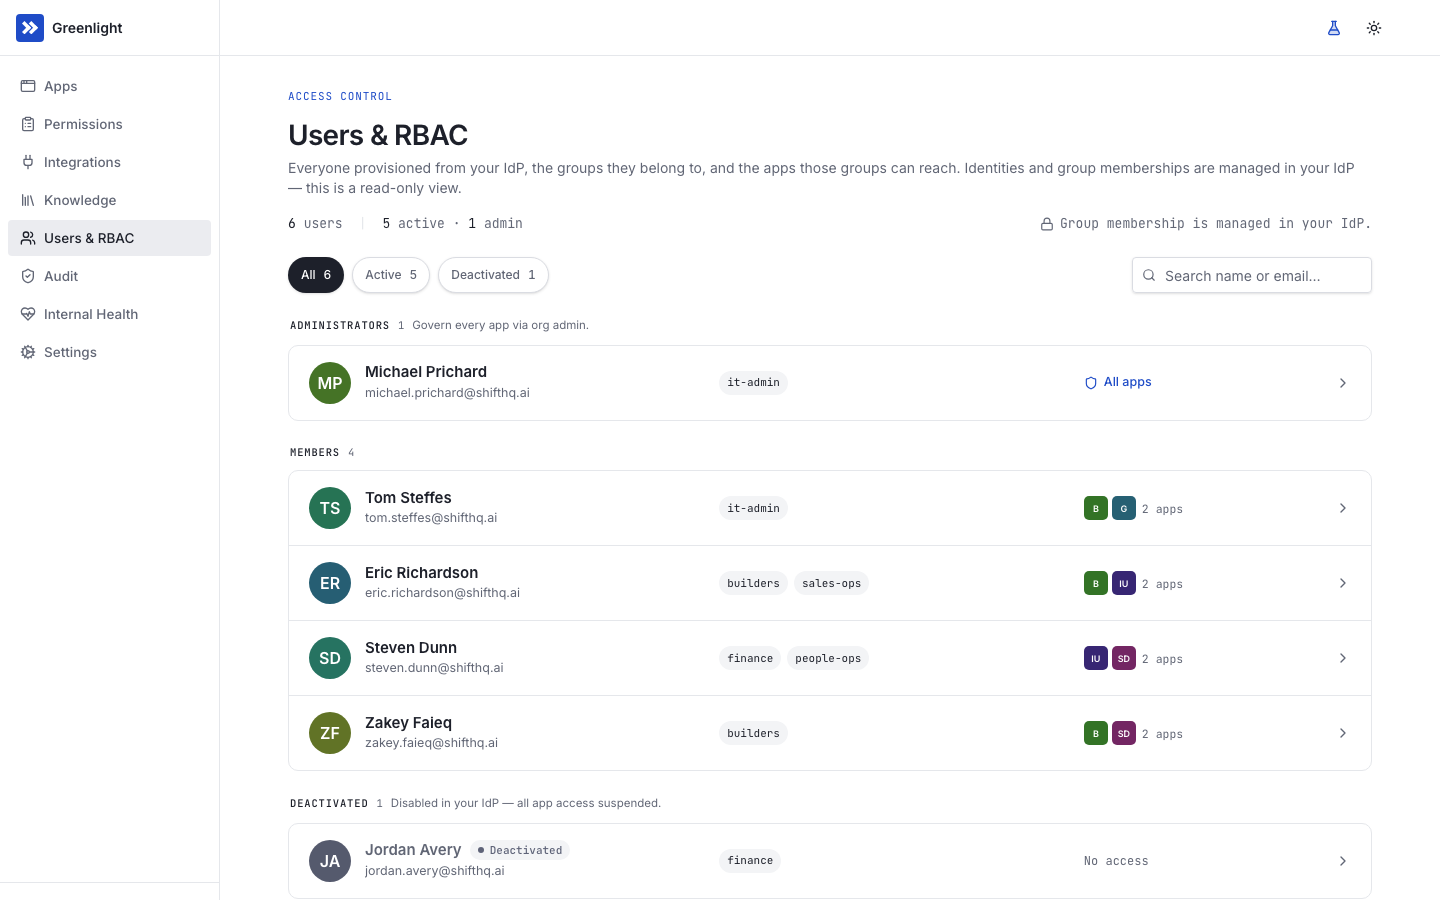
Section titled “Users & RBAC”The user directory and the group-to-role mapping table that turns IdP groups into Greenlight roles. Selecting a user opens an inspector with their identity and groups, the apps they own or co-own (each links straight to that app), and the restricted apps they have been named on. Apps that are open to your whole organization aren’t listed there — everyone can already reach those. Admins and Org Owners always have access to every app, so the inspector says so rather than listing named grants. Org Owners can also Log in as an Admin or Builder here to see the dashboard under that person’s role (audited, with a Stop banner). → Identity, SSO & RBAC
Apps nobody is using
Section titled “Apps nobody is using”Greenlight can pause apps that have gone unused, so an estate does not fill up with forgotten apps still holding access to company data. It is off until an administrator turns it on, under Settings → Unused apps, where the two day counts also live: how long an app has to be quiet before its owner hears about it, and how long before it is paused.
Once it is on, Greenlight checks once a day. An app that has gone quiet gets its owner one email — your app is scheduled to be paused — linking to the app’s own page, which shows the same warning as a banner with the two things that stop it: open the app (using it is what resets the clock) or confirm it is still needed. If nothing changes by the second threshold the app is paused: it stops serving and its access to your data is revoked. Pausing is fully reversible, nothing is deleted, and the app can be restored from its page at any time.
On the apps list, any app heading for a pause carries a Scheduled to pause badge beside its status, and administrators get a Last Used column showing when a person last opened each app.
Apps that are idle by design — a job that runs once a month — can be exempted so they are left alone entirely.
Internal health
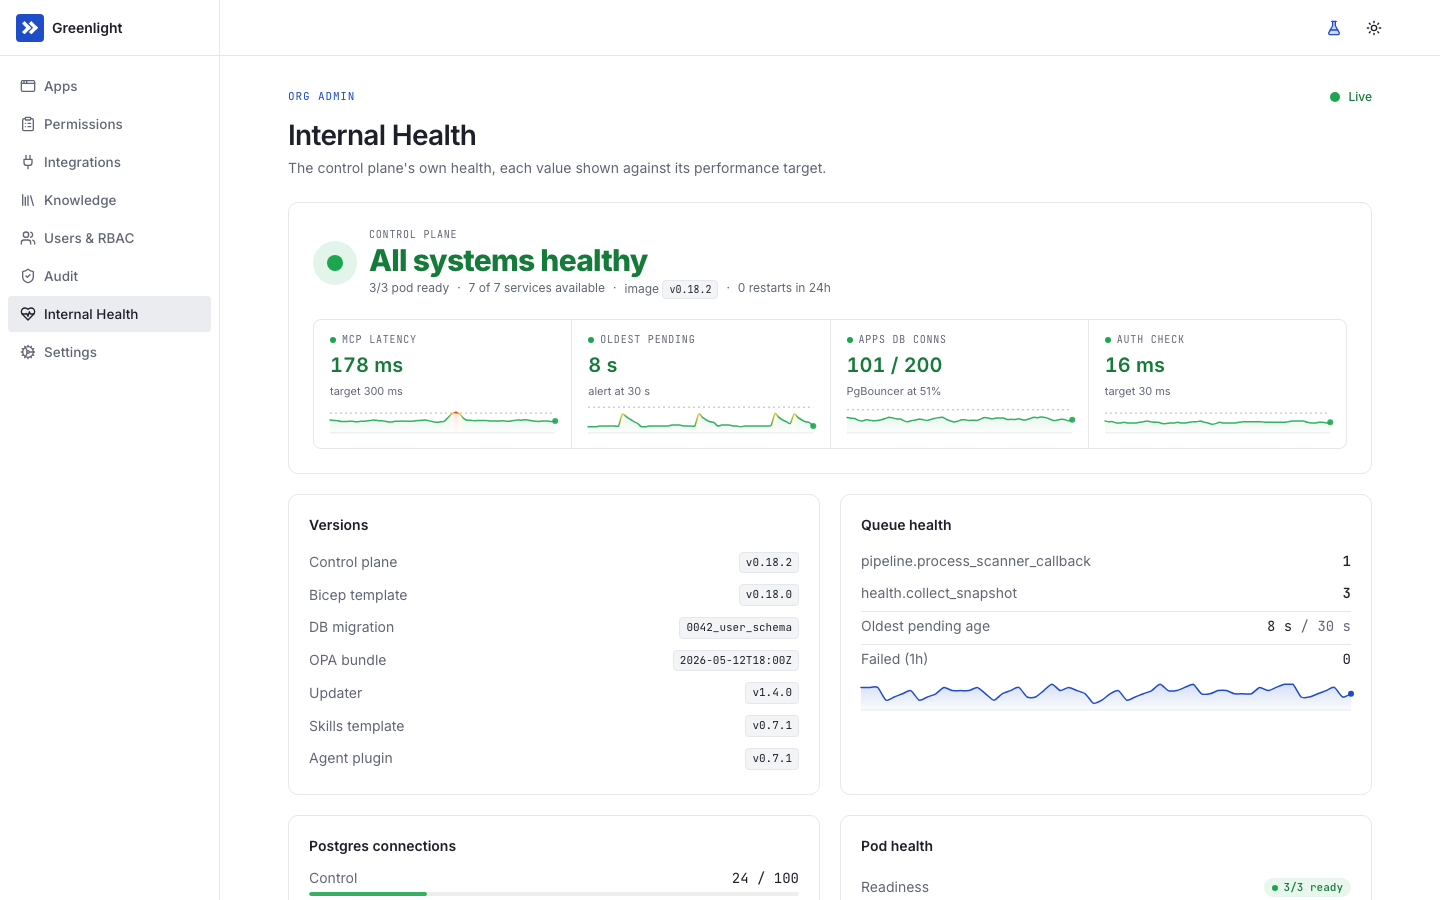
Section titled “Internal health”The control plane’s own health against its performance targets—MCP latency, queue depth, database connections, pod readiness, the status of the cloud resources backing your install (compute cluster, database, secrets vault, registry, storage, DNS), component versions, and the state of the updater that keeps your install current. An Upstream services section covers the outside world Greenlight and your developers depend on: GitHub, plus the coding-agent vendors (Anthropic, OpenAI, Google AI, Cursor). The section says once where these states come from—Greenlight never calls the agent vendors on your behalf, so their own status page is all we know—and labels an individual row only when Greenlight measured it itself. When GitHub is impaired, everyone signed in sees a banner naming what may fail, not just admins, so nobody spends the outage assuming they broke something. An Updater section starts with where you stand — whether you are current or a newer release is waiting, and when the next run is due — with the schedule, time zone, prerelease posture, and last check and apply a click away under a details toggle, and then lists every retained update run ten at a time. Open one to read each phase with its duration and reason, the exact non-secret inputs the run replayed, and the run’s full log (infrastructure plan, application rollout, installer output), downloadable long after the run’s pod is gone. A run that applied its release but failed one closing check is labelled as exactly that rather than as a failure, and a run whose Job finished without reporting reads as its own state. The same panel is the one place on this page with buttons: Preview update plans an update without applying it, and Apply now runs it immediately instead of waiting for the maintenance window—organization administrators only, one run at a time, both audited. An App crashes section lists containers your apps exited from—which app, a plain-language kubelet reason with the exit code, and when—and says in a line that a failed pipeline check is a different surface, so the two are not read as one problem. Sections that have nothing to report stay off the page rather than showing reassuring zeros: queue health appears only when a job is actually waiting or has failed, and the latency panel waits until it holds a real measurement. A Fleet Reporting section shows exactly what your install shares with Shift: the one-time enrollment payload (installation id, key hash, org name, tenant id, region) and the latest health report delivery with its exact JSON—redacted operational summaries only, never customer data. Failed pipeline checks are part of that summary as a check name, app slug, timestamp, and count; a check’s output—rule matches, diffs, log tails, commit messages—all quotes your source and never leaves the install. That report also carries an inventory of what your install brokers to—how many integrations you have registered, which catalog entries they came from, and, for ones you wired up yourself, the vendor’s registrable domain, so api.gusto.com is shared as gusto.com. The names you gave your integrations are never sent, and anything pointing at an internal or private host is shared only as private; you read all of it in that same verbatim payload. → Upgrades
Feedback
Section titled “Feedback”The channel where builder agents file platform-experience reports (bugs, friction, improvement ideas) and dashboard users file UX reports through the shell’s Send feedback dialog — available on every page. Org admins triage the combined list (filter by source, status, and category), see who sent each item, and read each report. Selected items can be handed to Shift’s platform team two ways — Download as a single Markdown file, or Send to Shift directly — and either way the document carries the report’s title and body but not who submitted it. A Settings → Org switch, off until you turn it on, sends new reports automatically instead. Handed-over items move to the bottom of the list rather than out of it; archive files them into their own view. Feedback content is treated as untrusted: capped, rendered inert, and rate-limited.
And the rest
Section titled “And the rest”- Policy — the active policy bundle as editable rules, the checks you require from your own scanners (or paste for Greenlight to run), and recent check results across all PRs. → Governance & policy
- Settings — org-level configuration: SSO (including reconfiguring or swapping the identity provider), the read-only update schedule, agent rollout snippets, notification destinations, and source control. Branch policy stays read-only (enforced at registration, not editable here), but the source-control tab also carries the GitHub App lifecycle actions: verify repo access, re-create the App, and migrate the org to a different GitHub organization. It also manages plugin marketplace repositories — create public or private sources, inspect all managed rows, recreate one if it was deleted on GitHub, or unregister one Greenlight should stop managing (the repository itself is left untouched on GitHub). Agent setup lets you select an agent and any of those sources for tailored rollout instructions; the Claude organization snippet installs Greenlight, starts Auto Mode, and pre-approves all Greenlight MCP and CLI actions—including control-plane-hosted CLI installation and refresh—without weakening Claude’s controls for unrelated tools. Notifications cover health/anomaly alerts, pending permission requests, and requests to connect a new system — deploy and pipeline failures are inspected on app and pipeline surfaces, not routed as alert categories. Pausing unused apps is its own section rather than a notification category, because the same switch governs both the warning and the pause. App-pod egress lockdown is not on yet; when it ships it will live here as an off-by-default toggle plus a host allowlist. Settings → Organization also carries the Shift contact — the administrator we reach about your trial and subscription, named during install and changed here whenever that person does; the card restates what is sent and shows “Not set” if your install predates the step.
- Settings → Maintenance — the update schedule, its time zone, the next run, and your prerelease posture, read-only. Run history and logs are on Internal Health. → Upgrades
What’s not in the dashboard
Section titled “What’s not in the dashboard”A few things deliberately aren’t here, because they belong somewhere else:
- App code — the source of truth is your SCM. The dashboard links out to the repo for every app.
- Long-term log analytics — ship cluster logs to your own aggregator. The dashboard’s logs view is for the live tail.
- Secret values — the dashboard shows that a secret exists; you read its value (if you have permission) through your cloud’s vault UI.
- End-user analytics for an app — the app’s owner builds that into the app, or hooks the app up to a real analytics product.